| RECON - service program for REDALS measuring device. |
| User's Guide / Online Help |
| |
Introduction
| Configuration |
Upload data |
Adjust data |
Finalize data |
Multigraph |
Erase data |
Device Test |
|
|
Introduction.
RECON is a program developed specially for graphical processing of data from REDALS measuring device.
It runs on any ordinary personal computer with Microsoft Windows operating system
and does not require any other software, but a Web-Browser.
The user can configure the program at any time. He can change the serial port number,
number of strain gages based load cells and their ranges, graph size and the
user interface language.
The raw measured data can be uploaded directly from the REDALS device via serial port
or read from a text file previously saved. The text file is an ASCII file. It
may be created as result of other computation or edited manually for the purpose
of final graph creation.
Data processing, especially clipping, is intuitive by dragging cursor lines over
the graph. It helps to eliminate effects like weight loss of the burning motor
when the motor is mounted in other than horizontal position.
The final graph is drawn with scale and grid lines for easy orientation. Initial values suggested by program
can be easily changed. The graph picture contains the temperature measured
during data recording, total burn time, maximal and average motor thrust, total
and after the propellant weight was given also the specific impulse. A text note
of any size can be added and saved together with to the graph. The graph can be saved
into BMP or GIF formatted files.
Multiple data series can be opened at once and an average graph is calculated
out of this data. This is called multigraph. Each data series can be shifted
manually on the time axis to match the common start point and its graph can have
different color.
Configuration.
After the program is started an empty window with menu on the top is displayed.
The first important menu item is Configuration. Click on it and the
configuration form shown on the right will appear :

Port number is a number of a serial port in your PC to which the REDALS
device is connected. While reading and processing data form locally stored
files, this setup is not meaningful.
Loadcells is a list of all load cells used an their maximum allowed force
in Newton [N]. For own-build load cells put here the measured value after
calibration, for commercial products enter the value from the certificate or
from the catalogue. The list is scrollable and editable. At least one value must
be present.
Size of graph in pixels is horizontal and vertical size of the raw and
final graph. Same setting is used to save the graph as image. Too low values
will cause distortion of the graph due to the screen raster. Too large value
will cause graphs exceeding the visible window or screen. For standard screen
800x600 pixels the appropriate graph size is 640x480, for higher resolution
screen 1024x768 chose graph size of 800x600.
Language is a the user interface language. en - English, cz - Czech.
Default on the first start is Czech. See note on the bottom.
Isp is a the choice of specific impulse in [s] - seconds or [Ns/kg] -
Newton seconds per kilogram.
Configuration is saved when you click on the OK push button. See note on the
bottom.
The background image of main window can be changed by replacing the file bg.jpg
located in the same directory as the program. If the file missing, standard
Microsoft background is presented.
Note: The actual program configuration is stored as recon.cfg located in
the same directory as the program. It must not be edited manually. If the file
is missing or corrupted, the program will issue an error message and will not
work. In such case restore the original recon.cfg file from the kit
and put it on its right place.
Note: All text translations for the different language flavors are stored in recon.lng
located in the same directory as the program. It is not intedet to be changed by
the user. If the file is missing or corrupted, the program will have only Czech
appearance. Experienced user may add new language translations by editing this
file. Read instructions in the file header first.
Upload data
By invoking this menu, RECON will read data from the REDALS device.
Pre-requisite is an existing connection to the device via serial communication cable.
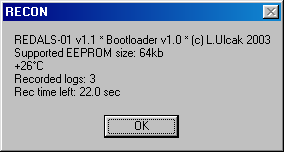
The following information is displayed first:

The actual version of the firmware, size of the EEPROM memory, actual
temperature and number of recorded sessions (logs) stored in the device are
shown.
In the subsequent step the measured data is uploaded.

Click on the log-number in the list to start the data upload. Uploaded data is
then displayed and processed in an new window. The upload can be aborted by
clicking on the Cancel push button.
When error occurs, a warning message is displayed and the upload is aborted.
Verify carefully the connectors, the cable, the communication port setup and the
REDALS device. The orange LED is flushing when the communication is properly
working and data is transmitted between REDALS and the PC.
Use data files.
Raw uploaded data or already processed data can be stored in files and analyzed
later. Also results of other measurements and calculations can be stored in such
files and used for graph generation. The Menu File -> Open
allows you to process data in the following stages:
- .txt - text files, raw measured data from one
recording session (log), ready for adjustment
If such file is opened, the program continues in the same way like the data
were uploaded directly from the REDALS device. Do not open other txt files
as such with this particular content! The program will not work properly.
- .rcn - adjusted data, ready for graph drawing
These files are created by RECON and contain finally adjusted data, comments
and parameters for graph drawing. You should backup them in order to protect
your own work. By using the same original data and different parameters you
can create multiple files and graphs.
- .rcs - scripts, for drawing multigraphs
These files contain instructions and parameters to build and draw
multigrapgs. They also contain references to the underlying .rcn
files.
All data files are ASCII and with the exception of text files have a unique
syntax. They are stored in the \data subdirectory.
Adjust data
After the upload of data from one session (log) or after a .txt file was
opened, the window below appears, the raw data is displayed. The graph considers
all existing data regardless of their length and magnitude.
The program suggests two vertical and one horizontal clipping lines. In the case
the motor was not mounted horizontally the bottom clipping line will be sloping.
This is due to the weight loss of the burning propellant. Use the mouse to drag
the lines and set the graph limits where you want. Use Zoom menu to focus
on spots and the arrows on the bottom to scroll the graph. The Smoothing menu item can be used to smooth data in
predefined levels. The three fields t1, t2-1 and t2 continuously display the
time position of the two clipping lines and their difference in seconds.
The menu item Loadcell is shown only if more then one load cell has been
configured. Select the load cell used when this data was recorded.
In order to continue processing with this set-up click on the Confirm menu item.
The final graph is then created.
Finalize data
After the uploaded data was adjusted or after a .rcn file was opened, the
window below appears, the final graph is displayed.
The violet vertical line is a movable ruler showing the precise trust and time
value at the intersection point. Use the mouse to move the ruler. In the menu Tools
-> Ruler this feature can turned on or off.
The menu item Loadcell is shown only if more then one load cell has been
configured. Select the load cell used when this data was recorded. Selecting
another load cell will distort the graph.
With the Back menu item you can step back to data adjustment.
When the graph is created for the first time, the program suggests values for
graph range, axis legend and grid size. Change these parameters with the Settings menu item.
It is recommended to round up values for the graph range and to set
event-numbered values for the legend and grid units. If you plan to
use multigraphs later, use equal setting for all graphs. Otherwise the graphs
cannot be compared. The propellant weight is used to calculate the specific
impulse. All values can be changed at any later time and a new graph will be
redrawn.
You should attach a note to each motor test in order to describe its conditions.
Use Comment menu item to enter or modify the text.
At his stage save your work into a file by using the File -> Save
menu item. The .rcn extension is added automatically.
Use the File -> Save image menu item to save the actual graph
as a picture in BPM or GIF format. The File -> Copy image menu
item copies the actual graph picture into the clipboard.
Multigraph
The multigraph window appears in two cases. First when you open a multigraph
previously saved in a .rcs file, and second when you open multiple
finalized graphs saved in .rcs files at once.
Each particular underlying graph is identified by a number and is drawn in gray
color. Click on the number to change the graph color. Use the arrows below the
number to shift the graph 0.5 seconds left and right. This allows you to put all
graphs at the same starting point.
The resulting calculated average graph is drawn in black and identified as "*".
Click on the "*" to change the resulting graph color.
When the graph is created for the first time, the program suggests values for
the graph range, axis legend and grid size according the particular .rcn
data files. Change these parameters with the Settings menu item.
It is recommended to round up values for the graph range and to set
event-numbered values for the legend and grid units. The propellant weight is used to calculate the specific
impulse. All values can be changed at any later time and a new graph will be
redrawn.
With the Smoothing menu item you can change the graph smoothing of the
each individual and the resulting graph. The original push button re-sets the
values stored in the particular .rcn data file.
Use the menu item File -> Save to save all your work into a .rcs
file. The .rcn extension is added automatically.
Use the File -> Save image menu item to save the actual graph
as a picture in BPM or GIF format.
Furthermore, by the File -> Save image menu item is possible to save only a graph. The standard windows dialog 'save file' is opened too. The image can be saved in standard windows format bmp or in compressed gif what is well disk space savings.
The File -> Copy image menu item copies the actual graph
picture into the clipboard.
Erase data
When you have processed and saved all measuerd data into .rcn files the memory of REDALS
device be erased before next measuring. This is done by the Erase data menu item.
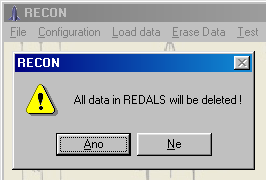
In order to prevent an accidental loss of data, the confirmation dialog is
displayed before the data is finally deleted.

When the action
successfully completes, the following window will appear:
With a special procedure it is possible to erase all in the device data
without this program and without connection to the PC. Please read the
instructions in the the REDALS manual.
REDALS device test
The device test mode allows check of the complete measuring device and calibration of a
the load cell. Start it with the Test menu item after you have connected
the device to the computer.

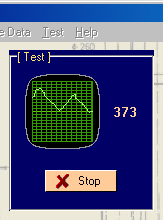
In
test mode the RECON device measures continuously the actual value and this is
displayed in interval of 0.2 seconds (5 measurements per second). When the
device works fine, small running graph window is shown with a number on the
right. Simulate some force by pressing the load cell
carefully with your fingers. You will see change in the running graph
and the number on the right will increase.
For precise load cell
calibration use reference force steadily acting on the load cell. Example: put
the load cell in vertical position and hang up a series of calibrated weights on
it up to the maximum load cell range. Observe the change of the measured value.
The value increase must be linearly proportional to the weight. In idle state
the measured value need not be zero.
Stop the test mode by clicking on the Stop push button. Recorded sessions
(logs) are not affected by the test.


 In
test mode the RECON device measures continuously the actual value and this is
displayed in interval of 0.2 seconds (5 measurements per second). When the
device works fine, small running graph window is shown with a number on the
right. Simulate some force by pressing the load cell
carefully with your fingers. You will see change in the running graph
and the number on the right will increase.